
EBSD Explained
Techniques
Applications
Hints and Tips
Technology
OXFORD INSTRUMENTS EBSD PRODUCTS
CMOS Detector RangeAZtecHKL Acquisition SoftwareAZtecCrystal Processing Software
Electron Backscatter Diffraction (EBSD) detector sensitivity is an important and often discussed topic when comparing the capabilities of EBSD detectors, yet is frequently misunderstood. On this page we examine the whole field of detector sensitivity including what it means and how we can quantify it, before looking at the impact of fibre optics on the overall detector performance.
A higher detector sensitivity is beneficial for all types of EBSD analysis and is not just a requirement for the analysis of beam-sensitive materials. In particular, high sensitivity detectors will enable:

An EBSD orientation map from a metal halide perovskite solar cell, collected using the highly sensitive Symmetry S2 EBSD detector.
High sensitivity EBSD detectors are opening up new application fields, such as the characterisation of organic thin films including metal halide perovskite solar cells, such as in the image above.
Browse the sections below to learn more about EBSD detector sensitivity and the importance of fibre optics.
Note - More information about detector sensitivity can be found in the technical bulletin “High Sensitivity EBSD Detectors”, available here.
Every EBSD experiment will have a desired outcome. That outcome will be specific to the experiment in question, as shown in the following examples:
The sensitivity of the EBSD detector refers to the minimum electron dose required to achieve the experimental aim.
The electron dose can be defined as:
Electron Dose = Beam Current x Exposure time (units: nAms)
Note that the electron dose is not the same as the beam current: working with a very small beam current does not equate to using a low electron dose (for example, small beam currents may require very long exposure times, resulting in a relatively high electron dose).
So, in turn, we can define sensitivity as:
Sensitivity = 1/(Minimum Electron Dose)
We usually express this in terms of the maximum achievable analysis speed per unit of beam current, in patterns per second (pps) per nanoAmp (pps/nA). However, remember that the definition of sensitivity takes into account the nature of the experiment, so this needs to be defined when specifying the sensitivity of an EBSD detector.
Using the definition of sensitivity as a function of the minimum electron dose, as shown previously, we can empirically quantify the sensitivity of a detector as follows:
Note that this will be affected by both the material and the nature of the experiment. For example, the 3 maps below were all collected using the Symmetry S2 detector, but indicate very different sensitivities due to details of the experiments themselves.

Orientation map of a partially recrystallised Ni sample: detector sensitivity 868 pps/nA

Orientation map of a deformed quartz rock: detector sensitivity 65 pps/nA
 EBSD map showing strain around crack tips in steel")
High resolution kernel average misorientation map of strain around crack tips in a duplex steel sample: detector sensitivity 5.9 pps/nA
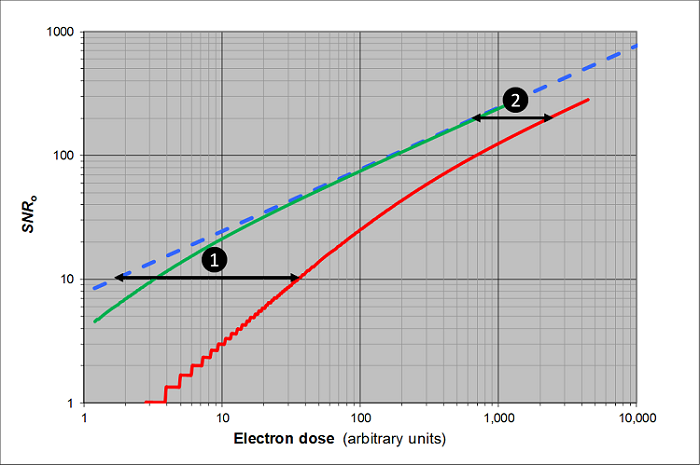
A more rigorous way to measure sensitivity would be to define the signal to noise (SNR) ratio in the detector’s image of the diffraction pattern. As the electron dose increases, the SNR will increase to a level at which the EBSD pattern can be indexed to the desired level of precision or reliability. Therefore, we can plot a detector’s SNR v electron dose curve and compare it to a theoretical ideal detector (i.e. a detector that adds no noise to the EBSD pattern signal, and has the SNR determined solely by the shot noise). In the chart, we compare an ideal detector (blue dashed line) with a high sensitivity detector (e.g. Symmetry S2 – green line) and a conventional, high-speed lens-based detector (red line).
For a particular experiment, we require a certain SNR value. For experiments requiring low SNR (i.e. in the low dose regime) we can see that the difference between an ideal, a sensitive and a conventional detector is significant (labelled (1)). For experiments in a higher dose regime, the sensitivity curve of the detectors approaches that of an ideal detector, although there still remains a significant difference between a sensitive and a conventional detector.

The SNR-dose curve for an ideal detector (blue) compared to a high-sensitivity detector such as Symmetry (green) and a conventional, lens-based high speed detector (red)
Conventional EBSD detectors have used an indirect electron detection (IeD) design, with a scintillator (i.e. a phosphor screen) coupled to the image sensor (either CCD or CMOS) using an optical lens. Each component in the detector has its own quantum efficiency (QE), and these combine to determine the overall efficiency of the detector – the detective quantum efficiency (DQE). This is what will determine the eventual sensitivity of the detector.
Commonly, there is a focus on the QE of the imaging sensor itself but, as highlighted below, the transfer of light from the phosphor screen to the sensor is where the greatest inefficiencies are found.
Phosphor Screen: At 20 keV electron energy, a typical high sensitivity phosphor screen will generate ~2500 photons for every incident electron, giving the phosphor a very high QE value of 2500.

Lens system: A standard lens has only a limited numerical aperture and will thus only collect a very small fraction of the photons emitted in the whole 2p sr hemisphere on one side of the phosphor. This is schematically shown on the right:
In fact, typically >99% of the photons will not impinge on the lens, and therefore, the QE of the lens system is <0.01.
Sensor: Most EBSD detectors use high efficiency sensors (CCD or CMOS) with a QE typically in the range of 0.6-0.7.
Even with the best quality lens system (e.g. with a numerical aperture of f/0.7, such as used in the Nordlys Nano CCD detector), it is clear that the inefficient capture of light within a conventional lens-based EBSD detector is the dominant factor in determining the overall detective quantum efficiency.
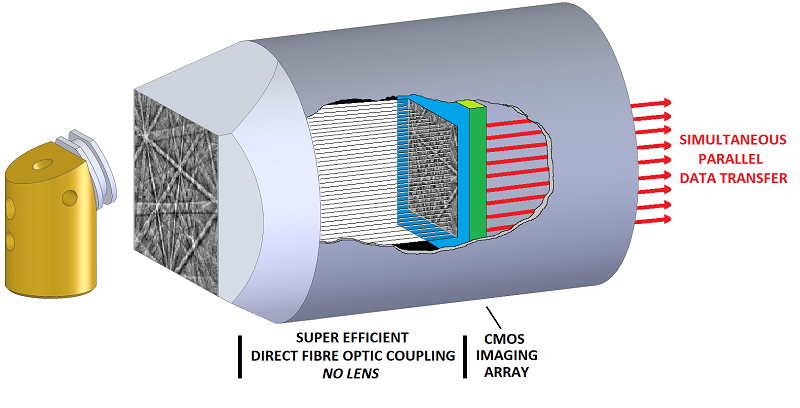
The Symmetry EBSD detector was the first commercial EBSD detector to utilise fibre-optic coupling between the phosphor screen and the sensor. This is shown in the schematic illustration on the right – all of the light is transferred from the phosphor screen directly onto the sensor, significantly improving the quantum efficiency of this part of the detector.
The SNR-dose curve for an ideal detector (blue) compared to a high-sensitivity detector, such as Symmetry (green) and a conventional, lens-based high speed detector (red)
Returning to the signal to noise ratio (SNR) v electron dose curve as shown on the left, the dramatic differences between the Symmetry fibre-optic coupled detector and a fast conventional lens-based detector can be accounted for purely by the vastly increased efficiency of a fibre-optic lens. For low dose applications (such as when mapping at very high speeds), this is equivalent to almost an order of magnitude sensitivity difference between the 2 detector types, reducing to approximately 3x sensitivity difference for high dose applications (such as for high resolution EBSD).
As a final note, all fibre-optically coupled EBSD detectors supplied by Oxford Instruments are guaranteed to have under 1 pixel distortion, making them ideal for pattern correlation approaches. Additionally, as in conventional detectors, replacement phosphor screens are readily fitted at the customer site, and the detector does not need to be returned to the factory.
© Oxford Instruments 2026