EBSD Explained
Techniques
Applications
Hints and Tips
Technology
OXFORD INSTRUMENTS EBSD PRODUCTS
CMOS Detector RangeAZtecHKL Acquisition SoftwareAZtecCrystal Processing Software
The centre lines of the Kikuchi bands in an electron backscatter diffraction (EBSD) pattern correspond to where the diffracting planes intersect with the phosphor screen (or direct electron detector sensor). Hence, each Kikuchi band can be indexed by the Miller indices of the diffracting crystal plane which formed it. The intersections of the Kikuchi bands correspond to zone axes in the crystal.
The pattern is a gnomonic projection of the diffracted cones of electrons onto the phosphor screen. The semi-angle of the diffracted cones of electrons is (90 - θ)°. For EBSD, this is a large angle so the Kikuchi bands approximate to straight lines. For example, the wavelength of 20 keV electrons is 0.00859 nm and the spacing of the (111) plane in Aluminium is 0.233 nm, making the cone semi-angle 88.9°.
The width w of the Kikuchi bands close to the pattern centre is given by:
.gif)
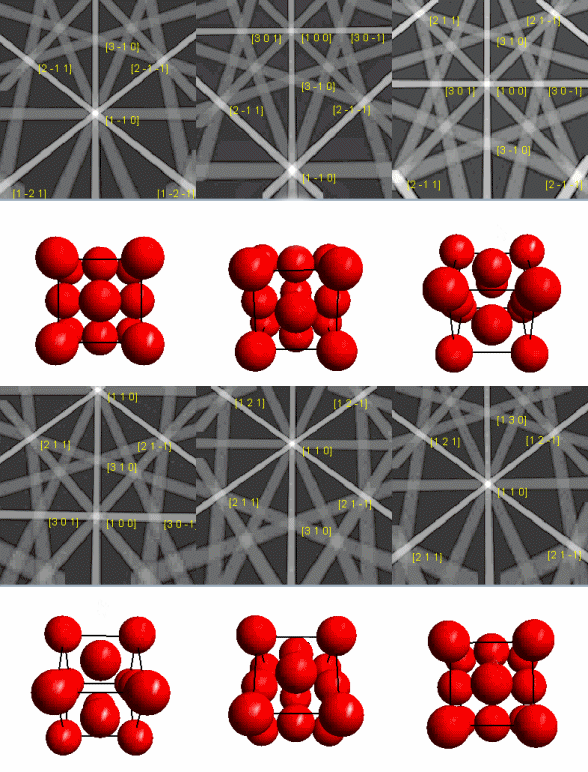
where l is the distance from the sample to the screen and, as before, n is an integer, λ is the wavelength of the electrons, d is the spacing of the diffracting plane and θ the angle of incidence of the electrons on the diffracting plane. Planes with wide d-spacings give thinner Kikuchi bands than those with narrower planes. Because the diffraction pattern is bound to the crystal structure of the sample, as the crystal orientation changes, the resultant diffraction pattern also changes. The positions of the Kikuchi bands can therefore be used to calculate the orientation of the diffracting crystal at the point where the beam interacts with the sample, and this is the basis of almost all automated pattern indexing methods. The relationship between the crystal lattice orientation and the resulting diffraction pattern is graphically represented using spherical diffraction pattern simulations in the image below, and in the subsequent animation.

Spherical diffraction patterns generated by different orientations of a cubic structure.

This animation shows the relationship between the crystal orientation and simulated diffraction pattern for a face centred cubic crystal. As the crystal rotates the diffraction pattern moves. (The simulated diffraction pattern is from a sample tilted 70° to the horizontal and the crystal orientation is viewed along the direction perpendicular to the sample).